Simulating Systematic Errors in Exoplanetary Transits for the James Webb Space Telescope
University of Central Florida Honors Undergraduate Thesis
(Press ? for help, n and p for next and previous slide; usage hints)
David Wright
April 9, 2021
Overview
- Motivation
- Literature Review and Relevant Work
- Methodology & Results - Adding JWST Features to ExoSim, Validation, and Comparisons
- Future Work and Closing Remarks
Motivation
Background Information
The upcoming™ James Webb Space Telescope (JWST) offers multiple observation modes tailored specifically for transit observation
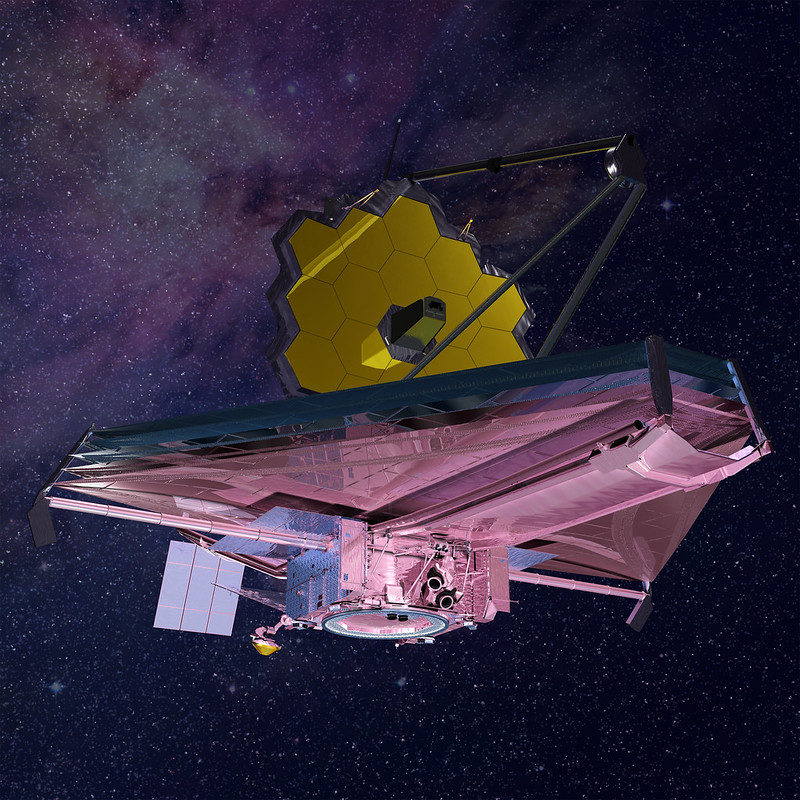
Figure 1: Artist render of JWST
Need
The community needs simulation tools that create realistic simulations including instrument systematic errors and noise
Literature Review and Relevant Work
Exoplanet Transits
In 1999, HD 209458 b was discovered via photometric transit observations [CH00]
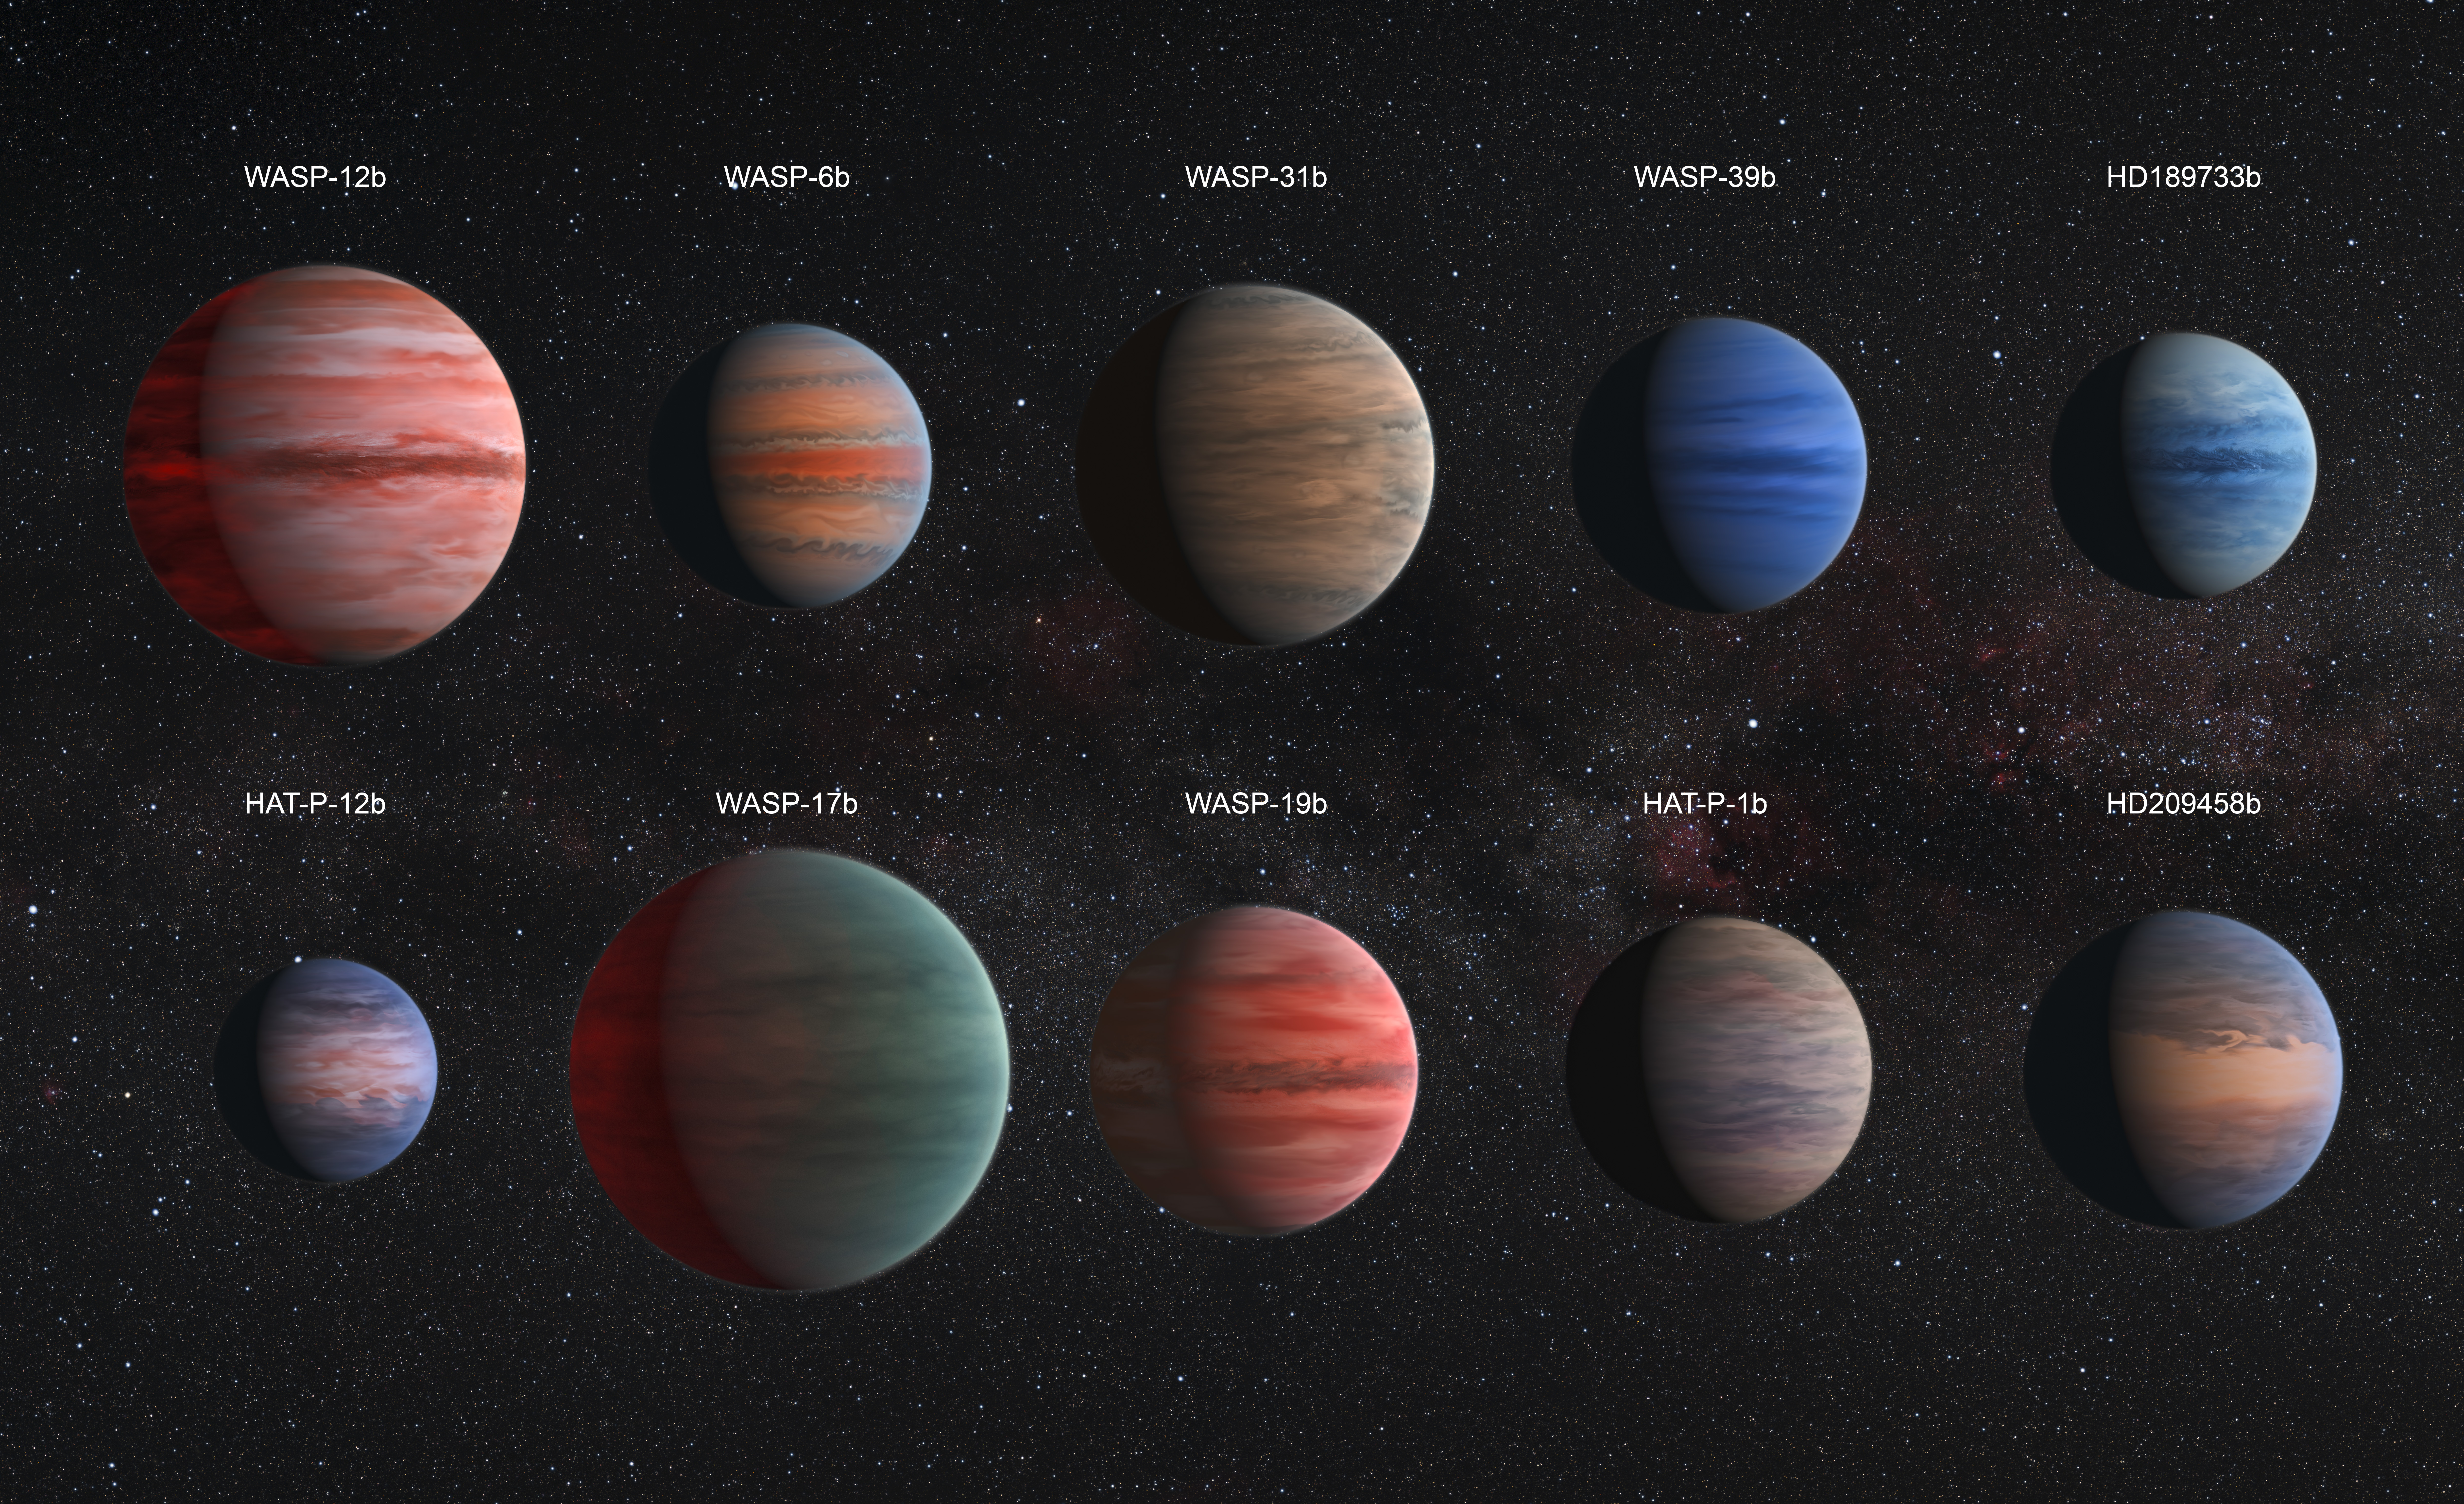
Figure 2: Hot Jupiters. Image Credit: ESA
Exoplanet Transits
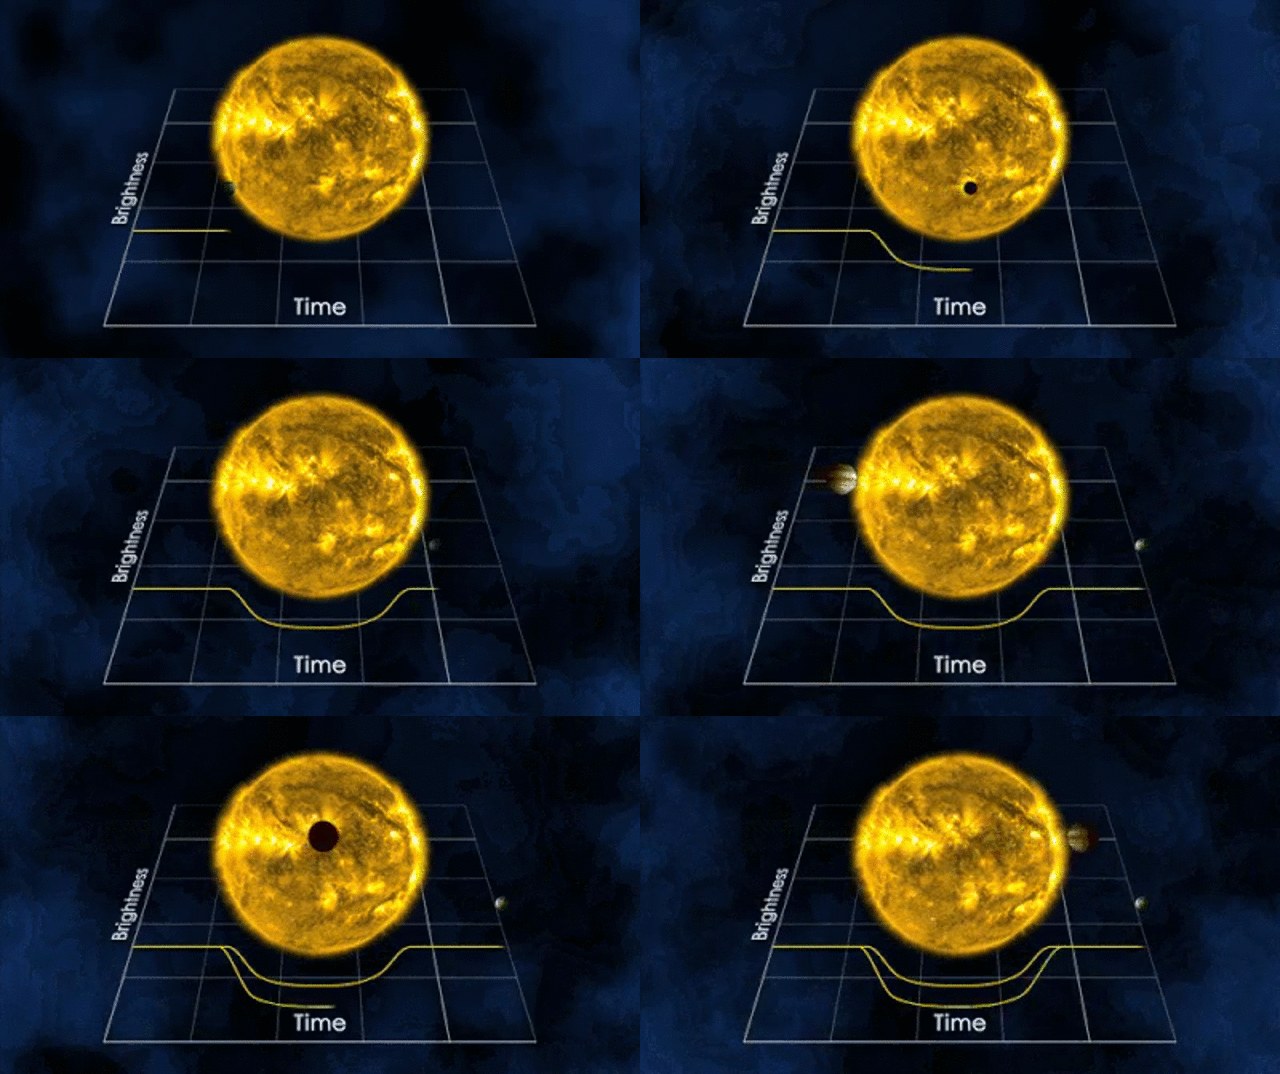
Figure 3: Animation of exoplanet transit. Animation credit: NASA
- Total flux of the star+planet system has a fractional decrease of \(\approx \left(\frac{R_P}{R_S}\right)^2 \), often called the transit depth
Exoplanet Transits

Figure 4: Animation of exoplanet transit. Animation credit: NASA
- The planet’s radius is \(R_P = R_S \sqrt{\textrm{Depth}}\)
- This is a small ratio, usually ~1-2% for a typical hot Jupiter
Exoplanet Transits
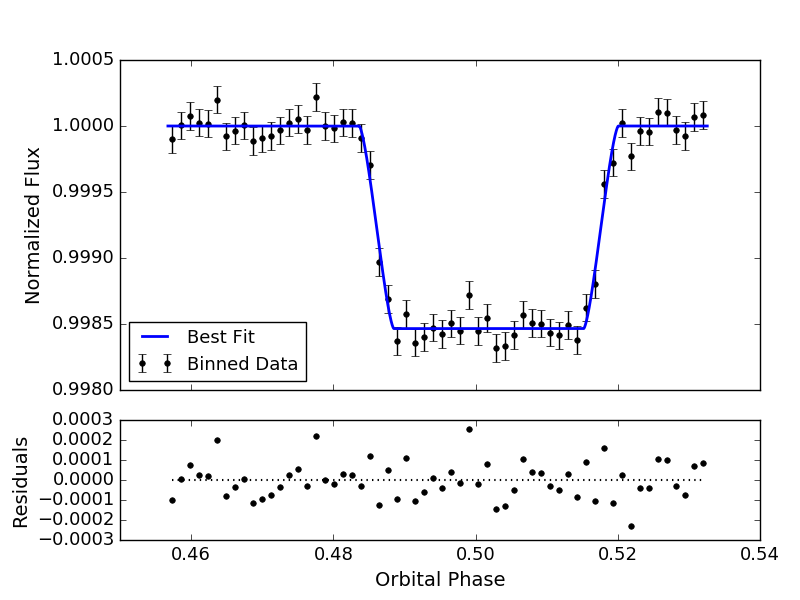
Figure 5: HD 209458 b light curve fit with a Mandel and Agol model. Image Credit: Kathleen McIntyre
- In practice, this ratio is found by fitting model light curves to the data, such as the model described by Mandel and Agol [MA02]
Exoplanet Transits
Spectroscopic observations yield more information on exoplanet atmospheres
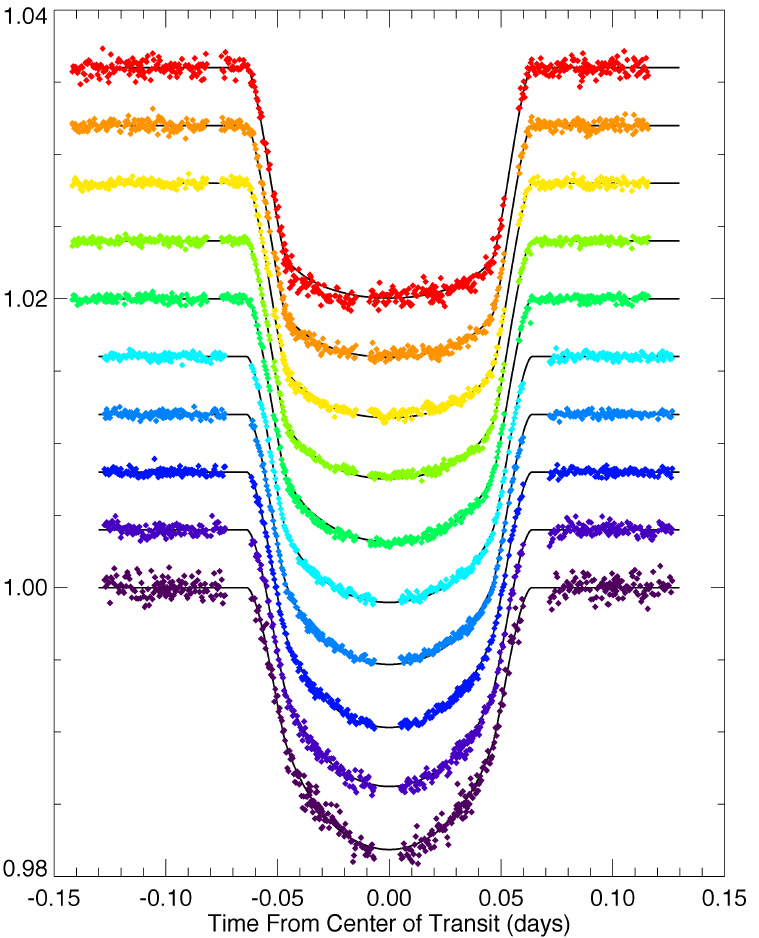
Figure 6: HD 209458 b light curves from \(0.29-1.04 \mu\textrm{m}\). Image Credit: Heather Knutson
Exoplanet Transits
The \(\left(\frac{R_P}{R_S}\right)^2 \) ratio at different wavelengths, \(\left(\frac{R_P(\lambda)}{R_S}\right)^2 \), is coined the “transmission spectrum”
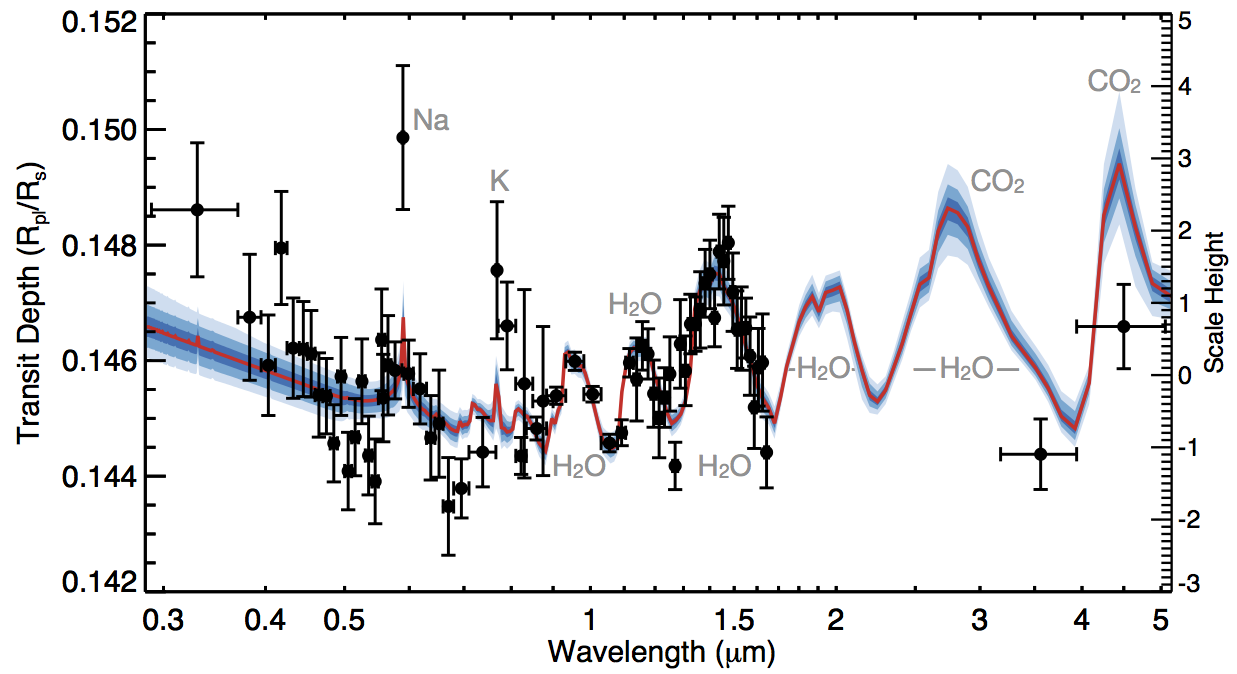
Figure 7: WASP-39b light curves from \(0.3-5.0 \mu\textrm{m}\). Image Credit: Wakeford et al. 2017 [WA17]
Exoplanet Transits
Transiting planets on circular orbits also pass behind their host star, known as an eclipse or secondary transit
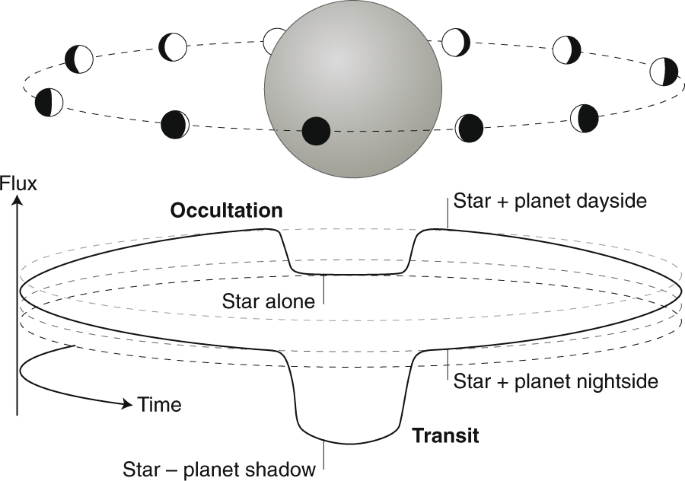
Figure 8: Exoplanet phase curve. Image Credit: Deming & Knutson 2020 [DK20]
Exoplanet Transits
As the planet passes behind its star, the observed flux decreased by \( \left(\frac{R_P}{R_S}\right)^2 \frac{ F_{\lambda,P} }{ F_{\lambda,S} } \) with \(F_\lambda\) being the emergent flux density of the planet or star

Figure 9: WASP-39b light curves from \(0.3-5.0 \mu\textrm{m}\). Image Credit: Wakeford et al. 2017 [WA17]
The James Webb Space Telescope (JWST)
The James Webb Space Telescope (JWST)
- JWST has exoplanet science as one of its main goals
- JWST will observe the 0.6–28\(\mu \textrm{m}\) range with detectors that are capable of greater than 100 parts per million (ppm) precision over time periods from hours to days [BE14]

Figure 10: Artist render of JWST
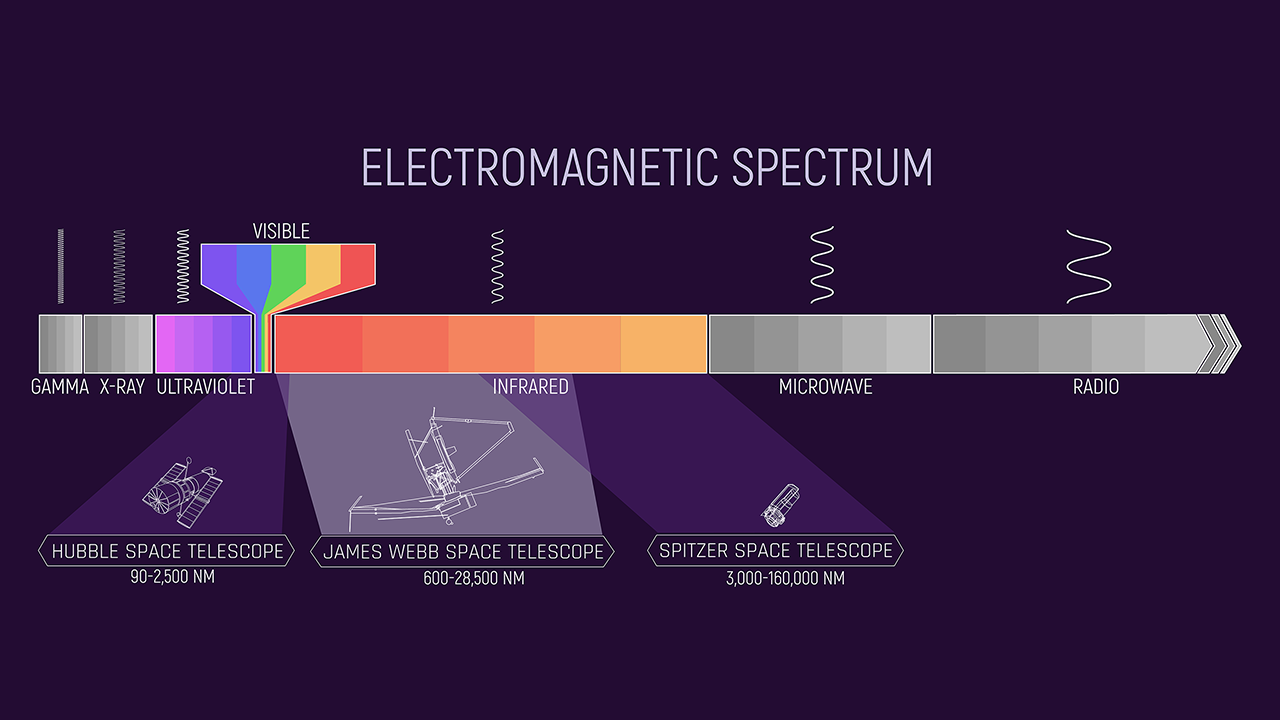
Figure 11: JWST wavelength coverage compared to Hubble and Spitzer
The James Webb Space Telescope (JWST)
- JWST has a 25\(\textrm{m}^2\) primary mirror, the largest of any space telescope to date
- It will orbit the Earth-Sun L2 point, providing extremely stable observations over long time periods
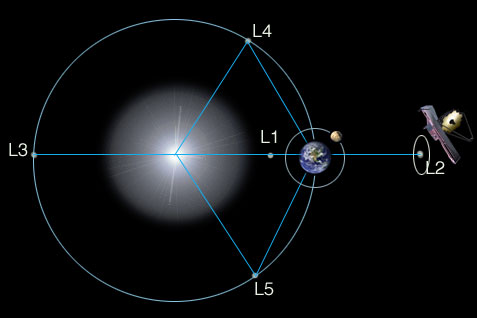
Figure 12: JWST orbit at Earth-Sun L2 point. Image credit: NASA
The James Webb Space Telescope (JWST)
- Webb carries four instruments on board:
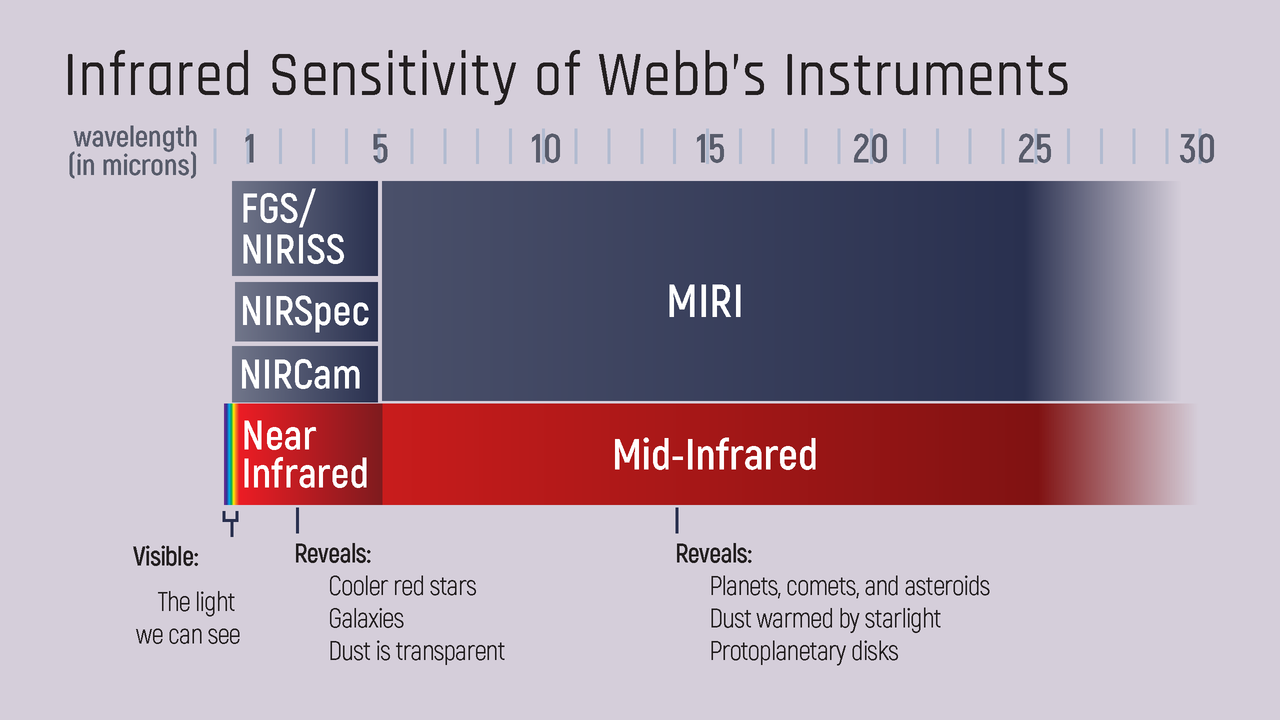
JWST Simulation Tools
Instrument Specific
- NIRSpec - N. Batalha [BA15]
- NIRISS - D. Louie [LO18]
- MIRI - P. Klaasen [KL20]
- NIRCam - J. Leisenring [LEPr]
General JWST
Methodology & Results
A Brief Overview of ExoSim
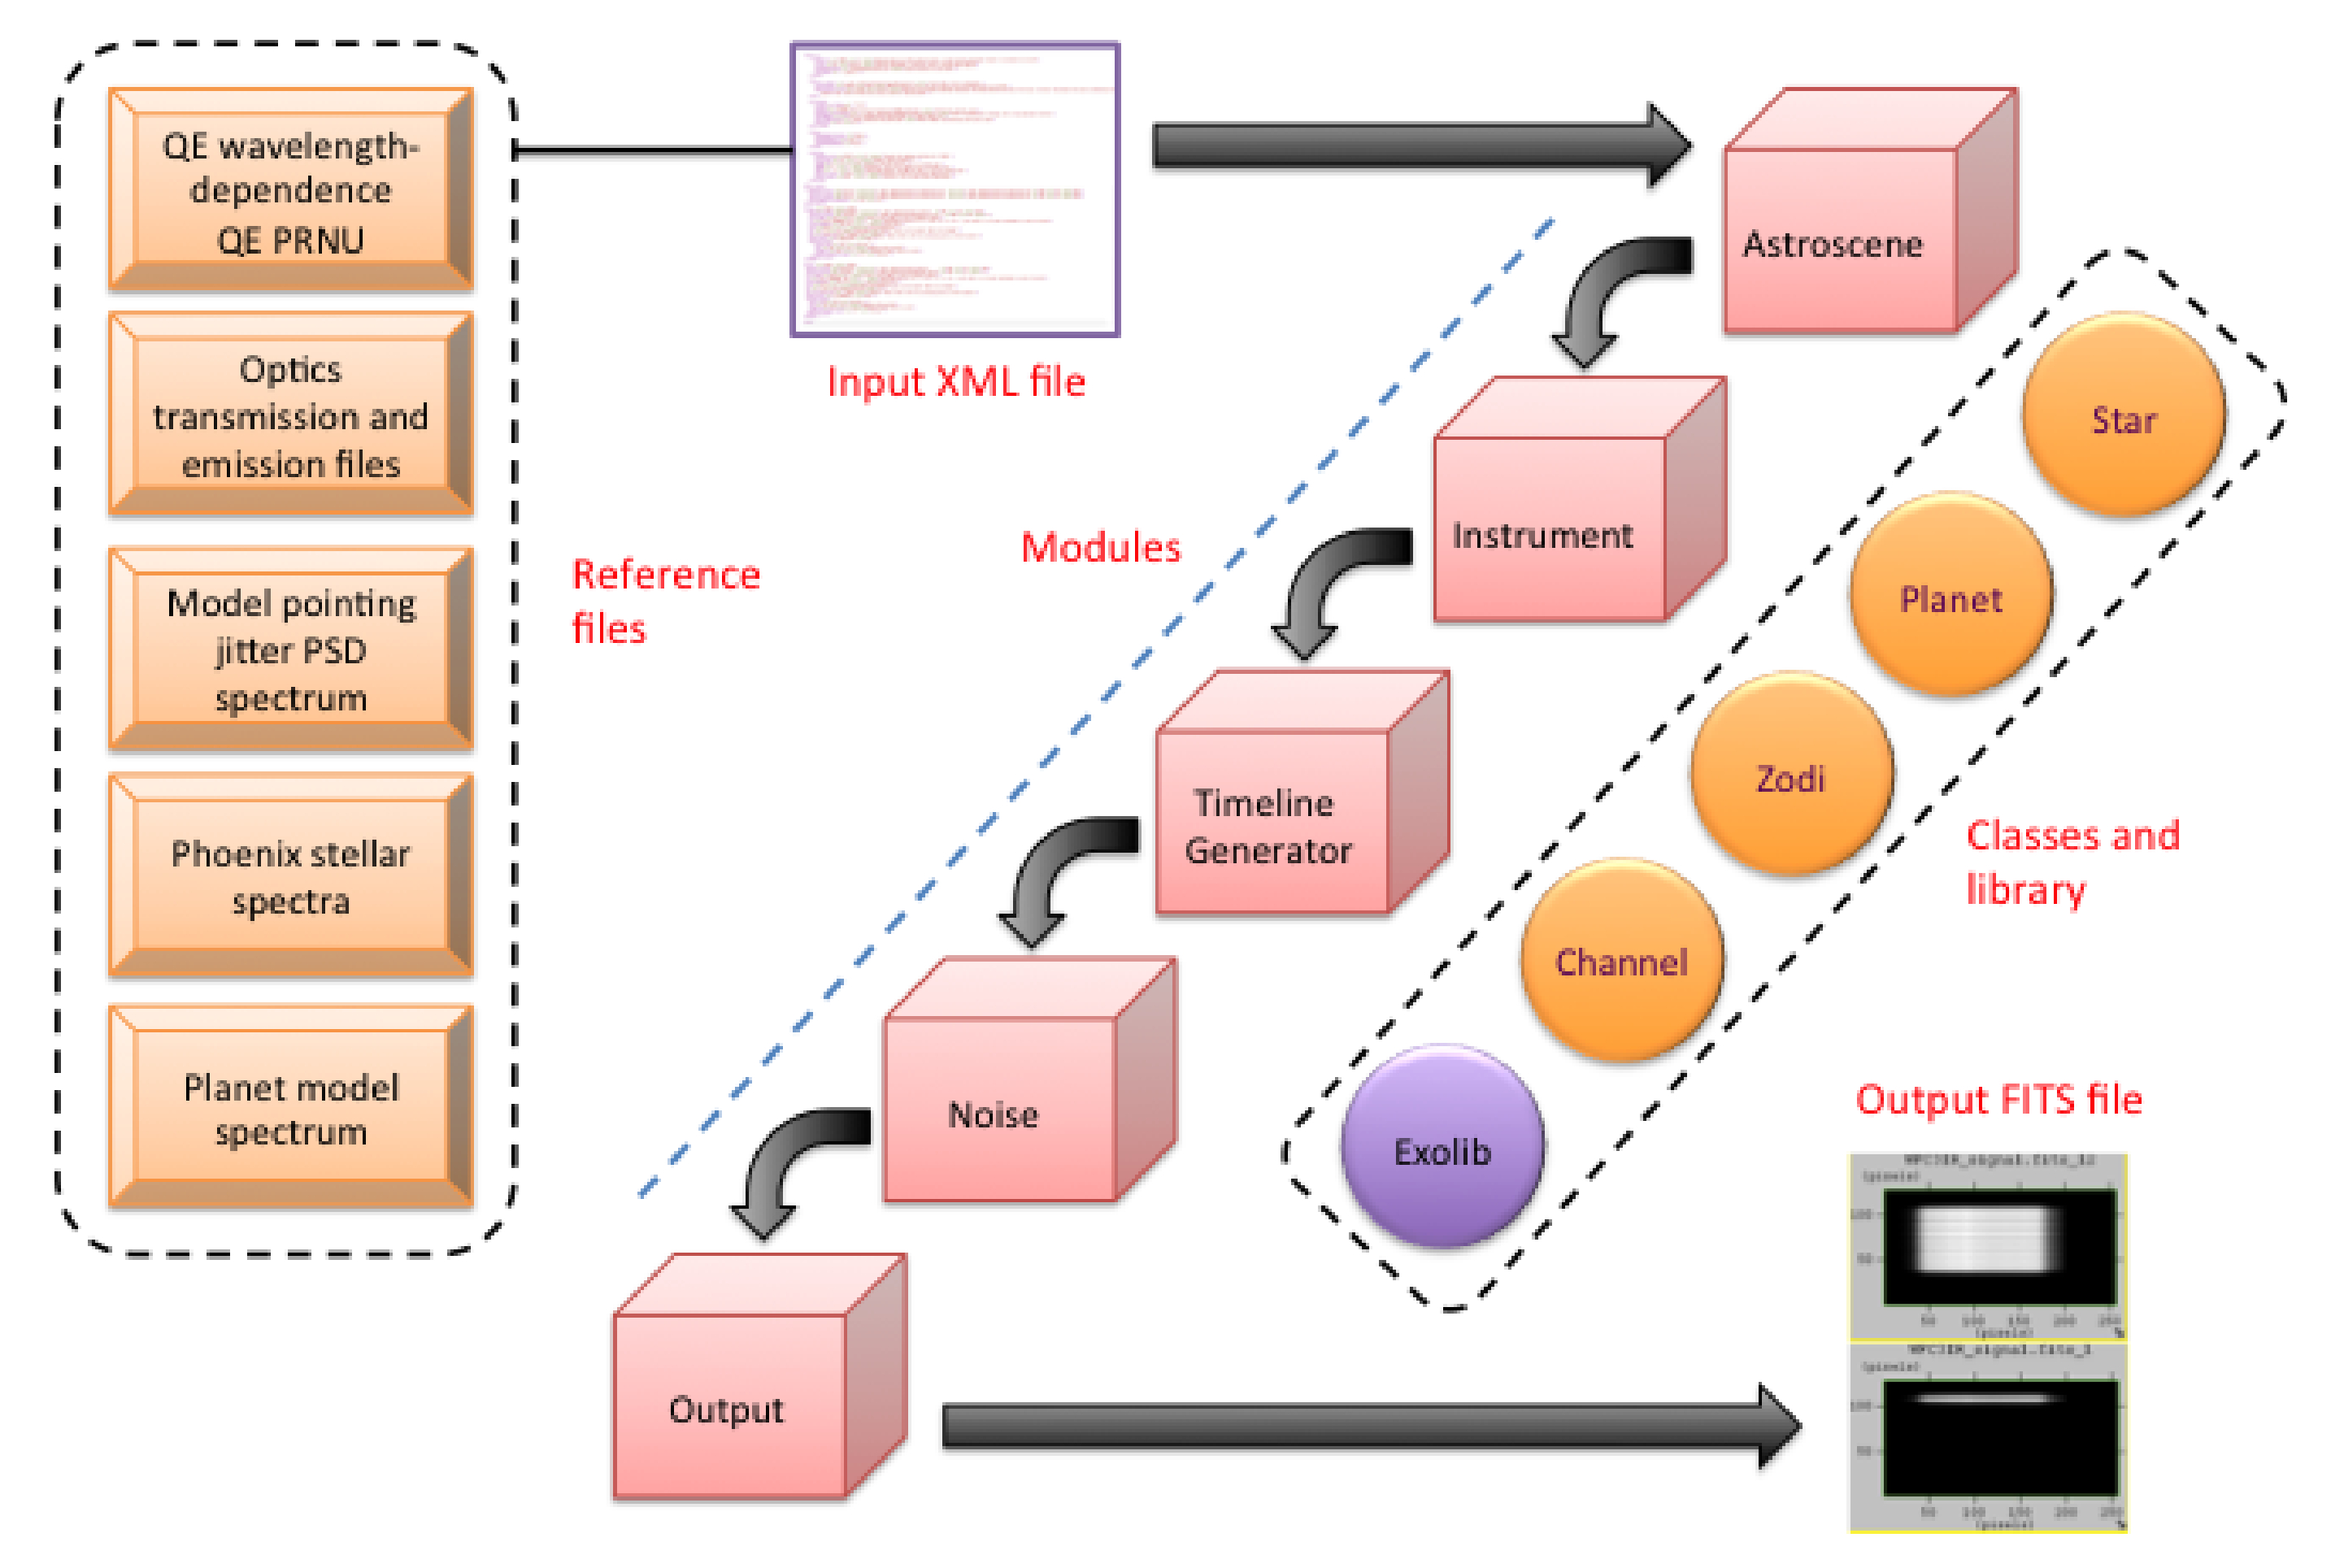
Figure 14: Overview of ExoSim Algorithm. Image credit: Enzo Pascale
Adding New Features to ExoSim
- In order to simulate JWST, ExoSim requires the following additional capabilities
- Simulation of curved spectral traces
- Simulation of multiple-ordered spectral traces
- Use instrument specific PSFs
- Support JWST detector readout patterns
- Parallelization
Curved Spectral Traces
Allow a 2D wavelength-pixel relation, \(\lambda(x,y)\)

Figure 15: NIRISS SOSS. Three orders cover a wavelength range of \(0.6-2.8\mu\textrm{m}\). Image Credit: STScI
Multiple-Ordered Spectral Traces
Simulate a focal plane for each spectral order and coadd

Figure 16: NIRISS SOSS. Three orders cover a wavelength range of \(0.6-2.8\mu\textrm{m}\). Image Credit: STScI
JWST Readout Patterns
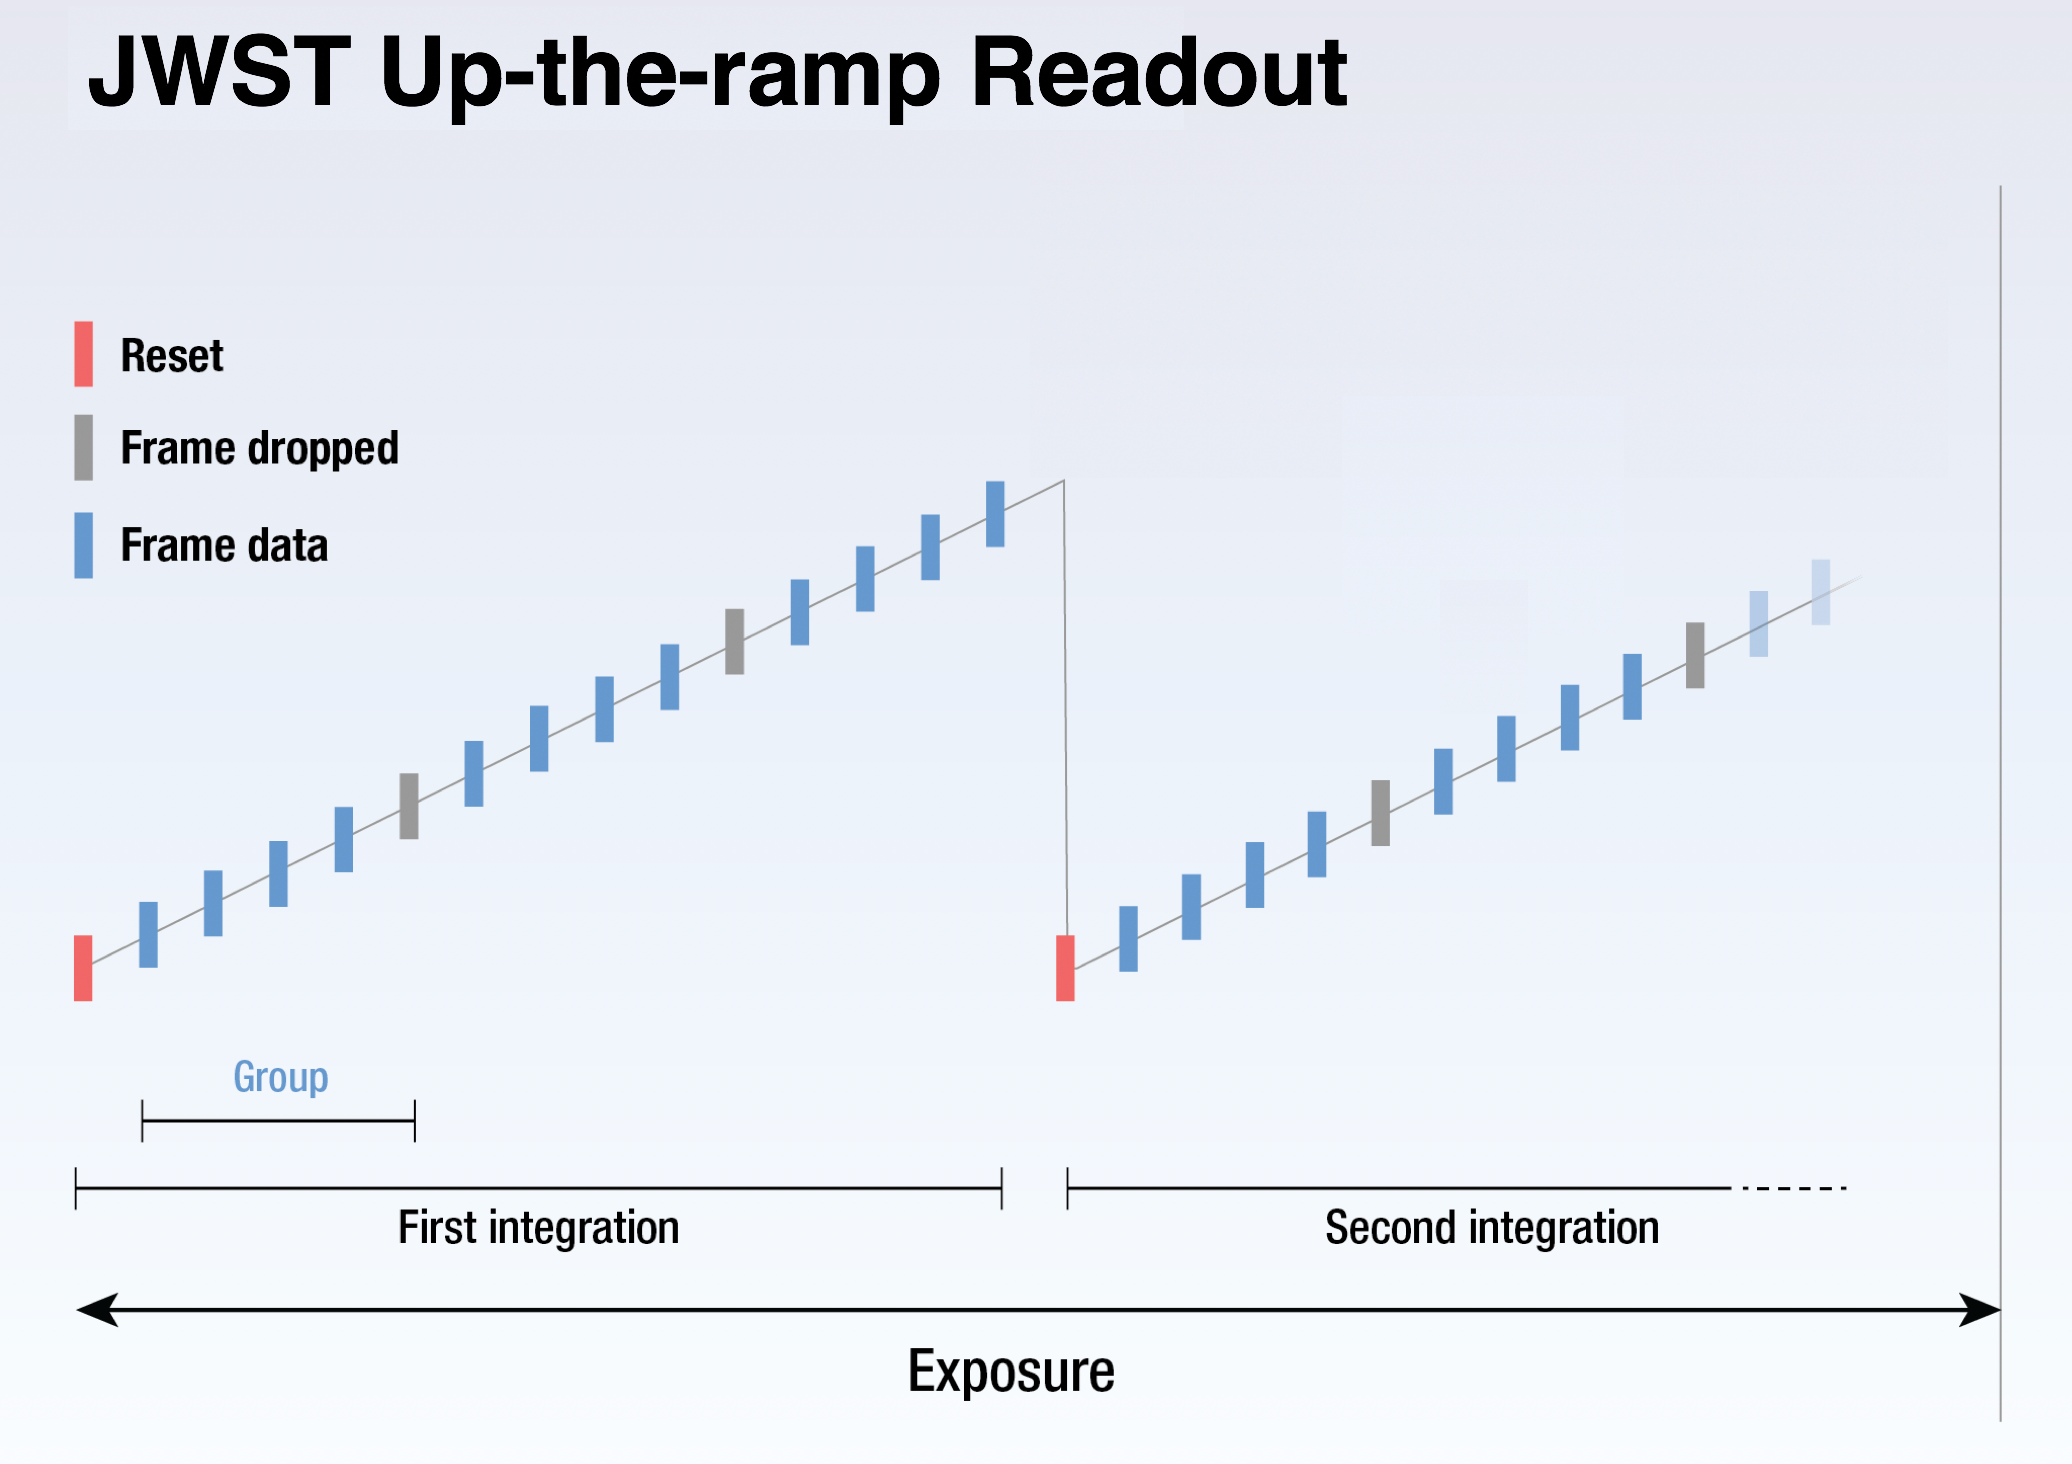
Figure 17: General structure of detector readout scheme used by all JWST detectors. Image Credit: STScI
| Readout | N\(_{frames}\) | N\(_{skip}\) |
|---|---|---|
| NISRAPID | 1 | 0 |
| NIS | 4 | 0 |
| NRSRAPIDD1 | 2 | 1 |
| SHALLOW4 | 5 | 1 |
Instrument Specific PSFs

Figure 18: Example PSFs from each JWST instrument and the fine guidance sensor.
Parallelization
Parallelization gives nearly an exact proportional decrease in run time for number of parallel processes

Figure 19: Dask parallel computing library task graph built during ExoSim execution.
Example NIRISS SOSS Simulation

Figure 20: NIRISS SOSS simulation from ExoSim.
Validation
Validating the Focal Plane Signal
A simulated black body was compared to an analytic expression
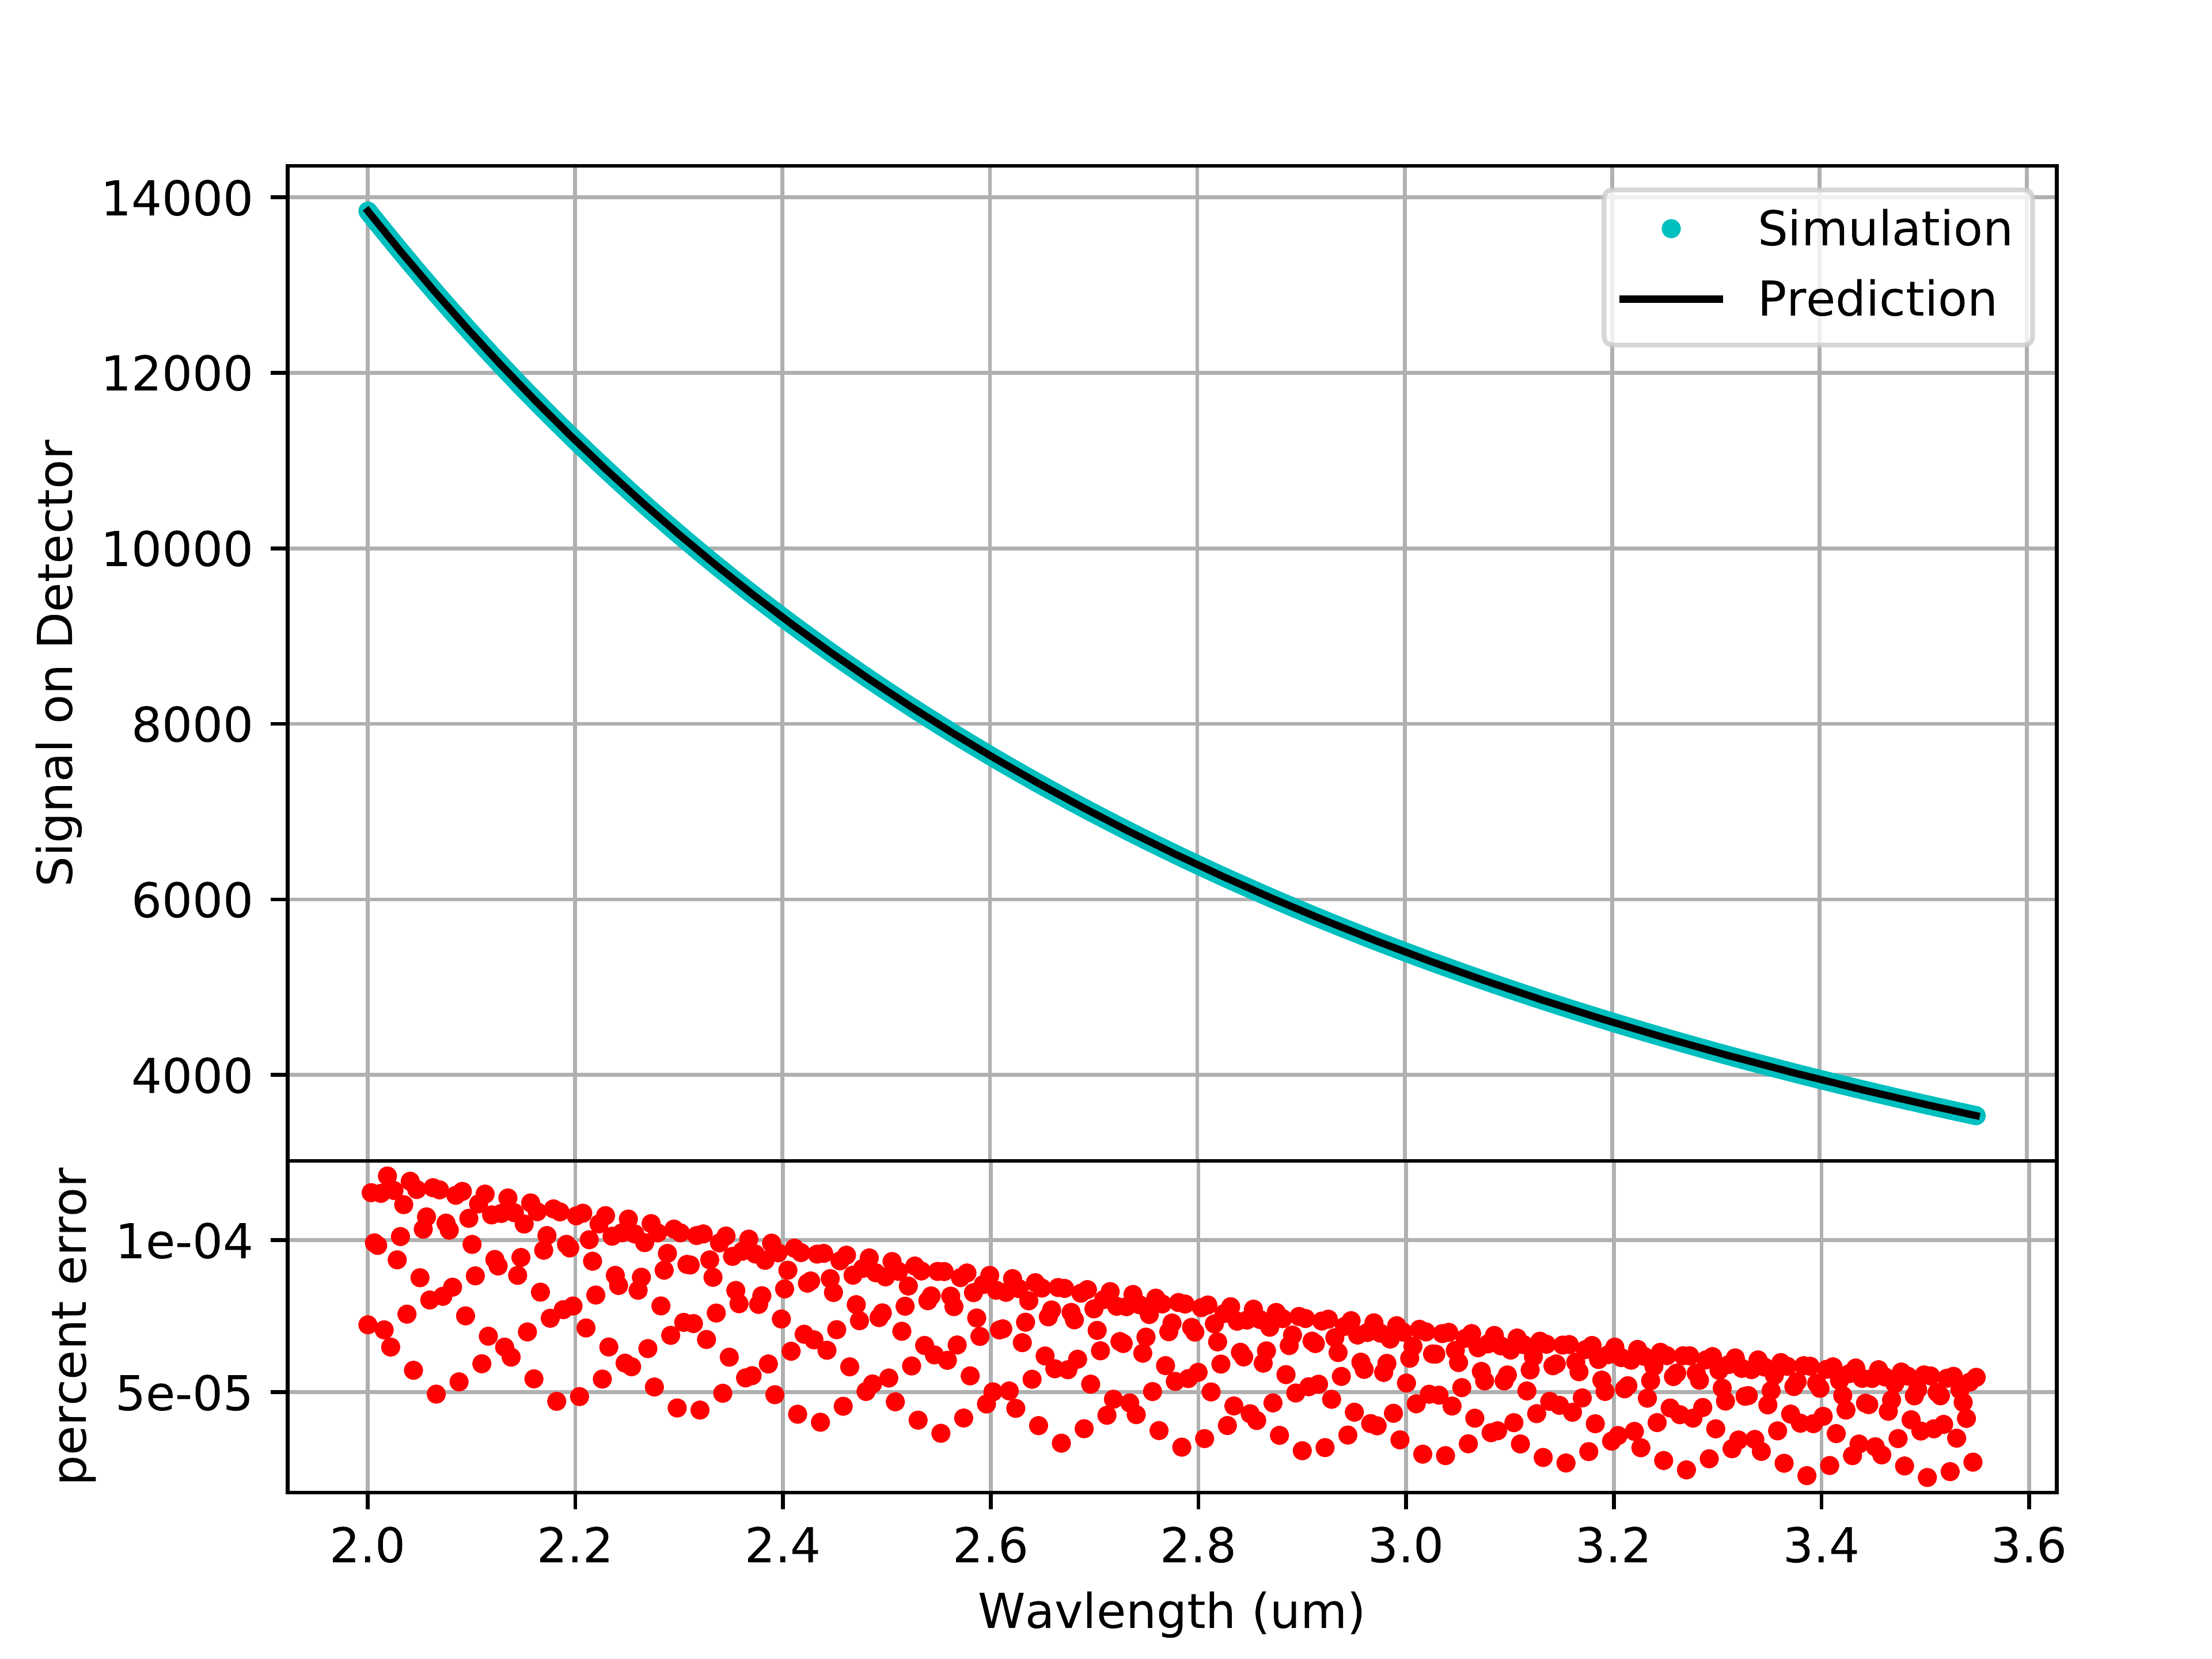
Figure 21: Flat spectral trace
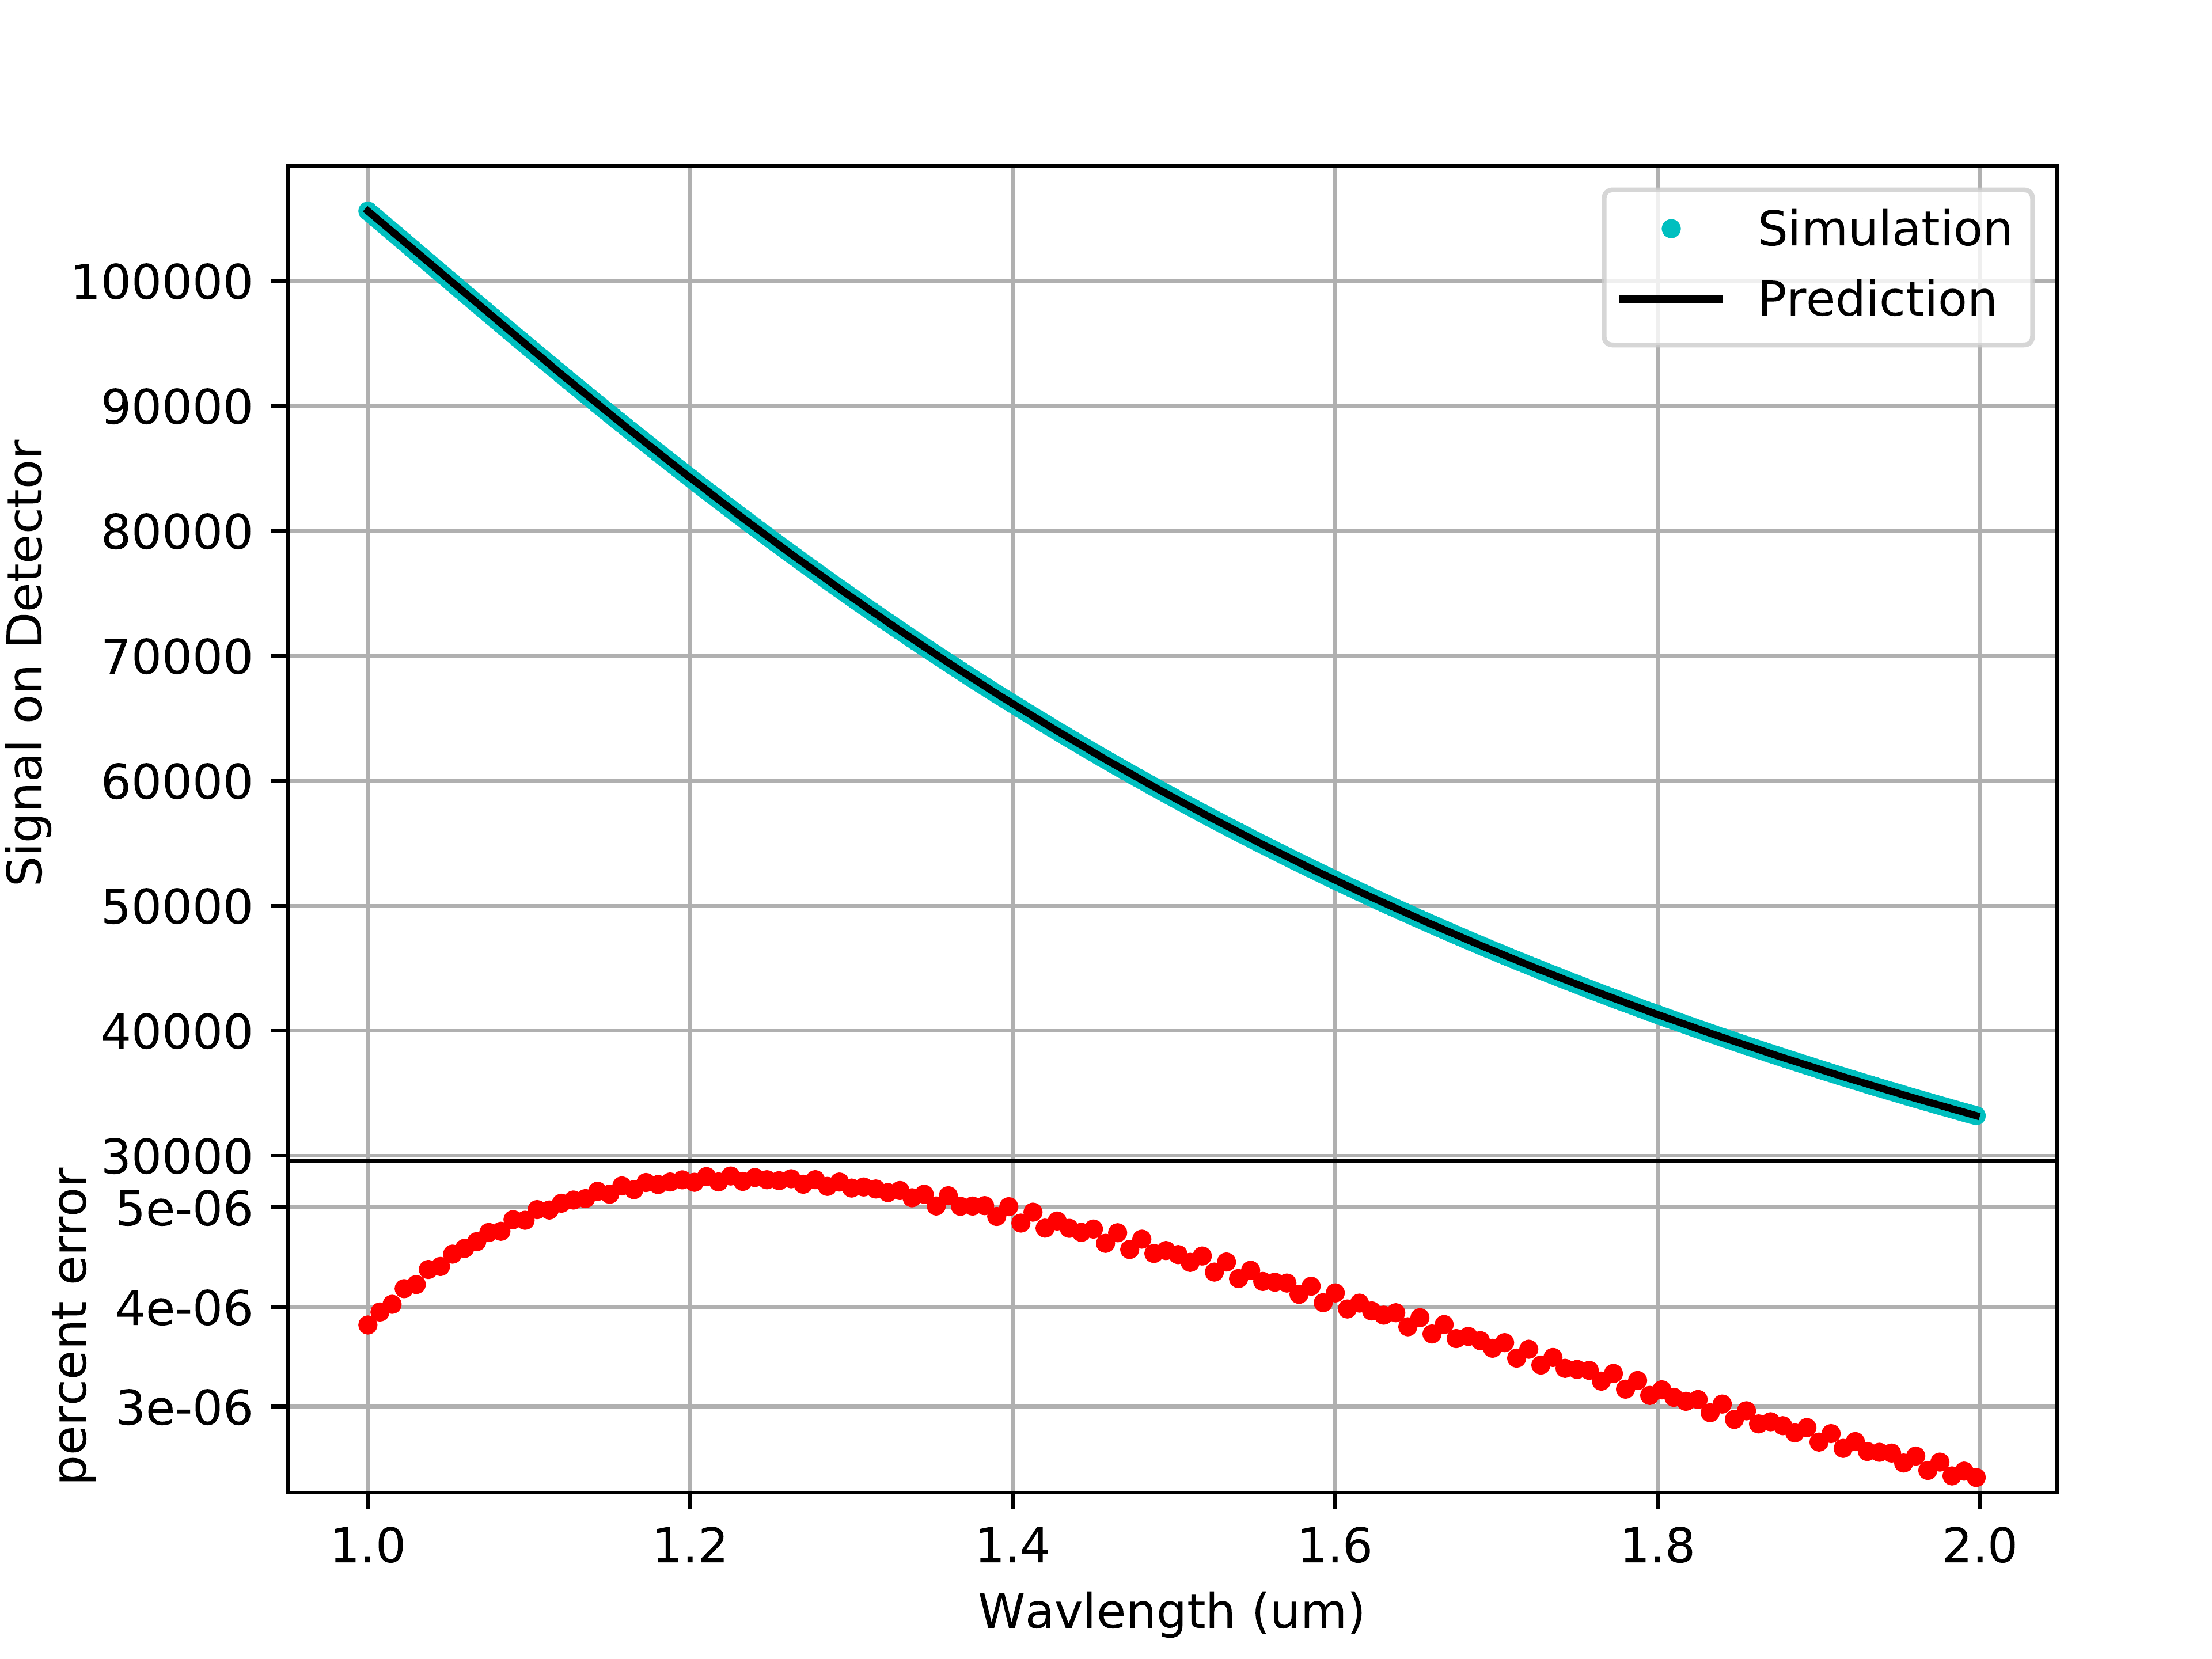
Figure 22: Curved spectral trace
Comparison to Original ExoSim
To ensure no unforeseen changes were made to the noise models, I ran identical simulations in my modified version of ExoSim and the original version.
Comparison to PandExo
| Parameter | NIRSpec BOTS | NIRCam F444W/Grism-R |
|---|---|---|
| Subarray | SUB512 | SUBGRISM64 |
| Size | \(32\ \times\ 512\) | \(64\ \times\ 2048\) |
| W\(_{slit}\)(pix)(pix) | 16 | N/A |
| \(\Delta_{pix}(\mu\textrm{m})\) | 18 | 18 |
| PS\((^\circ \times10^{-5}/\Delta_{pix})\) | 2.78 | 1.75 |
| T(K) | 40 | 40 |
Comparison to PandExo
| Parameter | NIRISS SOSS | MIRI LRS |
|---|---|---|
| Subarray | SUBSTRIP256 | SLITLESSPRISM |
| Size | \(256\ \times\ 2048\) | \(72\ \times\ 416\) |
| W\(_{slit}\)(pix) | N/A | N/A |
| \(\Delta_{pix}(\mu\textrm{m})\) | 18 | 25 |
| PS\((^\circ \times10^{-5}/\Delta_{pix})\) | 1.81 | 3.06 |
| T(K) | 40 | 7 |
Comparisons to PandExo - NIRSpec
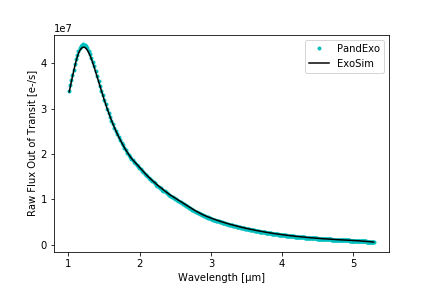
Figure 23: Comparison of PandExo and ExoSim simulation of NIRSpec. Average percent difference of \(+1.53 \pm 1.63\)%.
Comparisons to PandExo - NIRCam
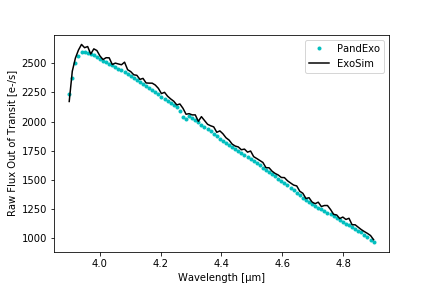
Figure 24: Comparison of PandExo and ExoSim simulation of NIRCam. Average percent difference of \(+2.18 \pm 1.08\)%.
Comparisons to PandExo - MIRI
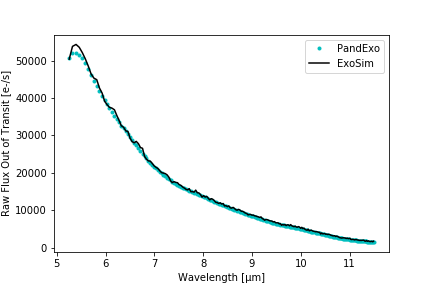
Figure 25: Comparison of PandExo and ExoSim simulation of MIRI. Average percent difference of \(+3.0 \pm 2.2\)%.
Comparisons to PandExo - NIRISS
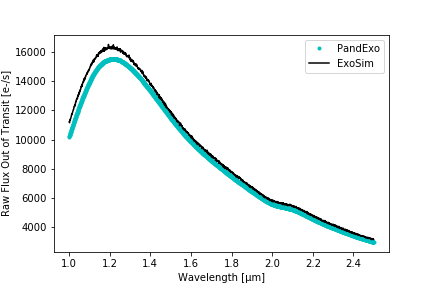
Figure 26: Comparison of PandExo and ExoSim simulation of NIRISS. Average percent difference of \(+4.54 \pm 1.37\)%.
Future Work and Closing Remarks
Future Work
- Write bridge between ExoSim and Pandeia
- Find cause of discrepancy between simulations
- Combine ExoSim, Py-JOSE, and BART for an end-to-end simulation and retrieval
Closing Remarks
In summary, I’ve described the development and validation of a time-domain simulator of exoplanet transits and systematic errors JWST.
This tool is open-source and available to the community with the hope that it is used to further our understanding of the effects of systematic noise on exoplanet transits and to prepare for observations of exoplanet transits with the James Webb Space Telescope.
Acknowledgements
Thanks to Dr. Joseph Harrington, Dr. Enzo Pascale, Dr. Ryan Challener, and Kathleen McIntyre for their support and guidance
Links
Bibliography
- [BA15] Batalha, Kalirai, Lunine, , Clampin & Lindler, Transiting Exoplanet Simulations with the James Webb Space Telescope, arXiv:1507.02655 [astro-ph] , (2015). http://arxiv.org/abs/1507.02655
- [BA17] Batalha, Mandell, Pontoppidan, , Stevenson, Lewis, Kalirai, Jason, Earl, Greene, Albert, & Nielsen, PandExo: A Community Tool for Transiting Exoplanet Science withJWST&HST, Publications of the Astronomical Society of the Pacific 129(976), 064501 (2017). https://doi.org/10.1088BA17.pdf1538-3873BA17.pdfaa65b0
- [BE12] Beichman, Rieke, Eisenstein, Daniel, Greene, Krist, McCarthy, , Meyer & Stansberry, Science opportunities with the near-IR camera (NIRCam) on the James Webb Space Telescope (JWST), in: Space Telescopes and Instrumentation 2012: Optical, Infrared, and Millimeter Wave, 2012. https://www.spiedigitallibrary.org/conference-proceedings-of-spie/8442/84422N/Science-opportunities-with-the-near-IR-camera-NIRCam-on-the/10.1117/12.925447.short
- [BE14] Beichman, Benneke, Knutson, , Smith, Lagage, Dressing, Courtney, Latham, Lunine, Birkmann, Stephan, Ferruit, Giardino, , Kempton, Carey, Krick, Deroo, Pieter, Mandell, Ressler, , Shporer, Swain, Vasisht, Ricker, George, Bouwman, Crossfield, Greene, , Howell, Christiansen, Ciardi, , Clampin, Greenhouse, Sozzetti, Alessandro, Goudfrooij, Hines, Keyes, Tony, Lee, McCullough, Robberto, Massimo, Stansberry, Valenti, Rieke, Marcia, Rieke, Fortney, Bean, , Kreidberg, Ehrenreich, Deming, , Albert, Doyon & Sing, Observations of Transiting Exoplanets with the James Webb Space Telescope (JWST), Publications of the Astronomical Society of the Pacific 126(946), 1134 (2014). https://iopscience.iop.org/article/10.1086/679566/meta
- [CH00] Charbonneau, Brown, Latham, & Mayor, Detection of Planetary Transits Across a Sun-like Star, The Astrophysical Journal 529(1), L45-L48 (2000). https://doi.org/10.1086CH00.pdf312457
- [DK20] Deming & Knutson, Highlights of exoplanetary science from Spitzer, Nature Astronomy 4(5), 453-466 (2020). https://www.nature.com/articles/s41550-020-1100-9
- [DO12] Doyon, Hutchings, Beaulieu, , Albert, Lafrenière, Willott, , Touahri, Rowlands, Maszkiewicz, , Fullerton, Volk, Martel, , Chayer, Sivaramakrishnan, Abraham, Roberto, Ferrarese, Jayawardhana, , Johnstone, Meyer, Pipher, & Sawicki, The JWST Fine Guidance Sensor (FGS) and Near-Infrared Imager and Slitless Spectrograph (NIRISS), in: Space Telescopes and Instrumentation 2012: Optical, Infrared, and Millimeter Wave, 2012. https://www.spiedigitallibrary.org/conference-proceedings-of-spie/8442/84422R/The-JWST-Fine-Guidance-Sensor-FGS-and-Near-Infrared-Imager/10.1117/12.926578.short
- [FE12] Ferruit, Bagnasco, Barho, , Birkmann, Böker, Marchi, , Dorner, Ehrenwinkler, Falcolini, , Giardino, Gnata, Honnen, , Jakobsen, Jensen, Kolm, Maier, Hans-Ulrich, Maurer, Melf, Mosner, Peter, Rumler, Salvignol, , Sirianni, Strada, Plate, & Wettemann, The JWST near-infrared spectrograph NIRSpec: status, in: Space Telescopes and Instrumentation 2012: Optical, Infrared, and Millimeter Wave, 2012. https://www.spiedigitallibrary.org/conference-proceedings-of-spie/8442/84422O/The-JWST-near-infrared-spectrograph-NIRSpec-status/10.1117/12.925810.short
- [KE15] Kendrew, Scheithauer, Bouchet, , Amiaux, Azzollini, Bouwman, , Chen, Dubreuil, Fischer, , Glasse, Greene, Lagage, , Lahuis, Ronayette, Wright, & Wright, The Mid-Infrared Instrument for the James Webb Space Telescope, IV: The Low-Resolution Spectrometer, Publications of the Astronomical Society of the Pacific 127(953), 623 (2015). https://iopscience.iop.org/article/10.1086/682255/meta
- [KL20] Klaassen, Geers, Beard, , O'Brien, Cossou, Gastaud, Coulais, , Schreiber, Kavanagh, Topinka, , Azzollini, De Meester, Bouwman, Glasse, , Glauser, Law, Cracraft, , Murray, Sargent, Jones, Wright & , MIRISim: A Simulator for the Mid-Infrared Instrument on JWST, Monthly Notices of the Royal Astronomical Society 500(3), 2813-2821 (2020). http://arxiv.org/abs/2010.15710
- [LEPr] pyNRC:, , .
- [LO18] Louie, Deming, Albert, , Bouma, Bean & Lopez-Morales, SimulatedJWST/NIRISS Transit Spectroscopy of Anticipated Tess Planets Compared to Select Discoveries from Space-based and Ground-based Surveys, Publications of the Astronomical Society of the Pacific 130(986), 044401 (2018). https://doi.org/10.1088LO18.pdf1538-3873LO18.pdfaaa87b
- [MA02] Mandel & Agol, Analytic Light Curves for Planetary Transit Searches, The Astrophysical Journal Letters 580, L171-L175 (2002). http://adsabs.harvard.edu/abs/2002ApJ...580L.171M
- [MA95] Mayor & Queloz, A Jupiter-mass companion to a solar-type star, Nature 378(6555), 355-359 (1995). https://www.nature.com/articles/378355a0
- [PO16] Pontoppidan, Pickering, , Laidler, Gilbert, Sontag, Christopher, Slocum, Jr, Sienkiewicz, Hanley, Earl, , Pueyo, Ravindranath, Karakla, , Robberto, Noriega-Crespo, Barker & Elizabeth, Pandeia: a multi-mission exposure time calculator for JWST and WFIRST, in: Observatory Operations: Strategies, Processes, and Systems VI, 2016. https://www.spiedigitallibrary.org/conference-proceedings-of-spie/9910/991016/Pandeia-a-multi-mission-exposure-time-calculator-for-JWST/10.1117/12.2231768.short
- [SA20] Sarkar, Madhusudhan, Papageorgiou & Andreas, JexoSim: a time-domain simulator of exoplanet transit spectroscopy with JWST, Monthly Notices of the Royal Astronomical Society 491(1), 378-397 (2020). https://academic.oup.com/mnras/article/491/1/378/5602604
- [SP20] Sarkar, Pascale, Papageorgiou, Andreas, Johnson & Waldmann, ExoSim: the Exoplanet Observation Simulator, arXiv:2002.03739 [astro-ph] , (2020). http://arxiv.org/abs/2002.03739
- [WA17] Wakeford, Sing, Deming, , Lewis, Goyal, Wilson, , Barstow, Kataria, Drummond, , Evans, Carter, Nikolov, Nikolay, Knutson, Ballester, & Mandell, The Complete transmission spectrum of WASP-39b with a precise water constraint, AJ 155(1), 29 (2017). http://arxiv.org/abs/1711.10529